Simply Reports: Creating a Weeding Report
Useful fields for a weeding report are:
- Item assigned collection name
- Item call number
- Item barcode
- MARC author
- MARC title
- MARC pub year
- Item creation date
- Item last circ activity date
- Item prev year circ count
- Item ytd circ count
- Item lifetime circ count
All of this information can be added as columns to your report.
First, log in to Simply Reports with the same username and password you use for Leap.
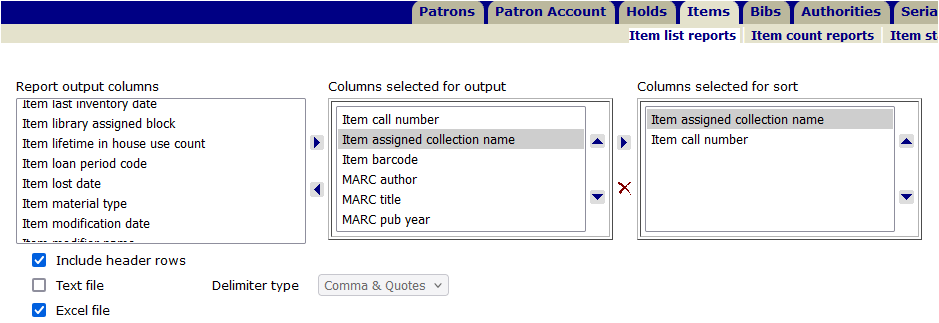
Select the Items tab, and make sure that the subtab “Item list reports” is selected.

To add columns to the report, double-click the column name in the “Report output columns” box and it will move the name over to the “Columns selected for output” box.
A helpful column to sort by is the collection, and then the call number. Remember you can sort your columns after you export the report to Excel too. Here are the columns for the report, including the two columns for sorting.
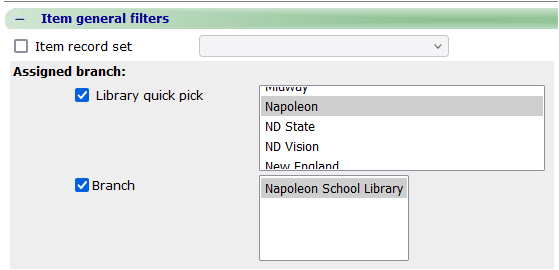
Next, it is important to set up filters for the report. Filters remove information from the report that is not relevant (like data from other branches) or confusing (like data from deleted item records).
Click the plus sign next to the section for “Item general filters.”
Click the box for library quick pick and highlight the branch. If your branch has related branches, you can narrow it down to the individual branch as well.
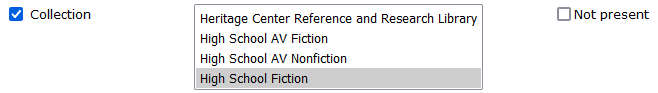
You can also filter by collection. This can be very helpful when you are just focusing your weeding on one collection at a time.
Click the box labeled Collection and highlight the collection.
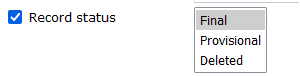
Next, we want to exclude deleted items from appearing on the report. Scroll down until you find the Record status check box. Check that and highlight “Final.”
Another helpful filter is Circulation status. It would make the report less confusing to have the items that are currently circulating excluded from the report. Scroll down to the Circ status check box. Check that and highlight “Available.”
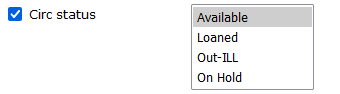
*Note – if you want Lost and Missing items to appear on the report skip this step and add the column for Item circ status to the report.
All the columns and filters are set up. Next, click “Submit” to view the report.
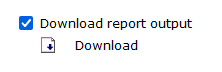
A new tab in your browser opens and displays the report. You can look at the report here and decide if it needs modification. When you are happy with the report, click the check box next to “Download report output” and click the Download icon.
After downloading the report to your computer, open it up in Excel. Excel will give you a pop-up warning:
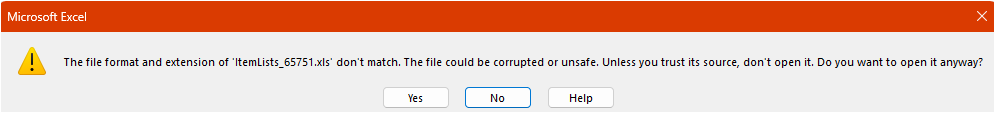
Simply Reports saves in an old version of Excel. It is safe to click “Yes” here to open the report.
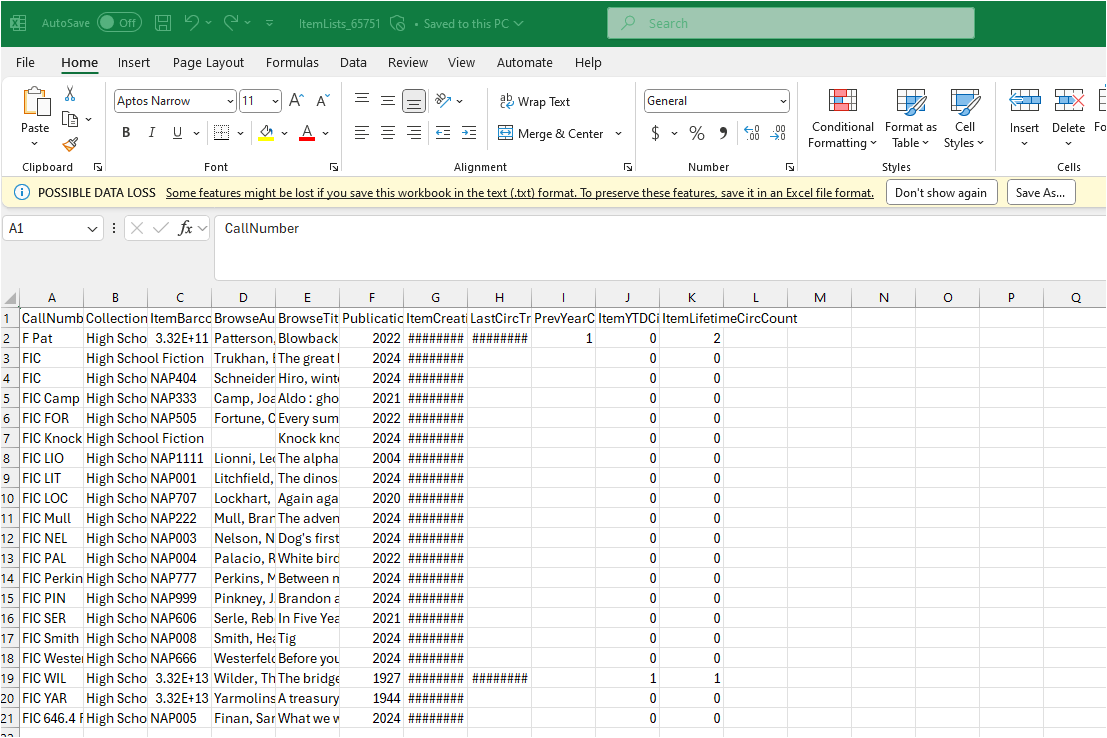
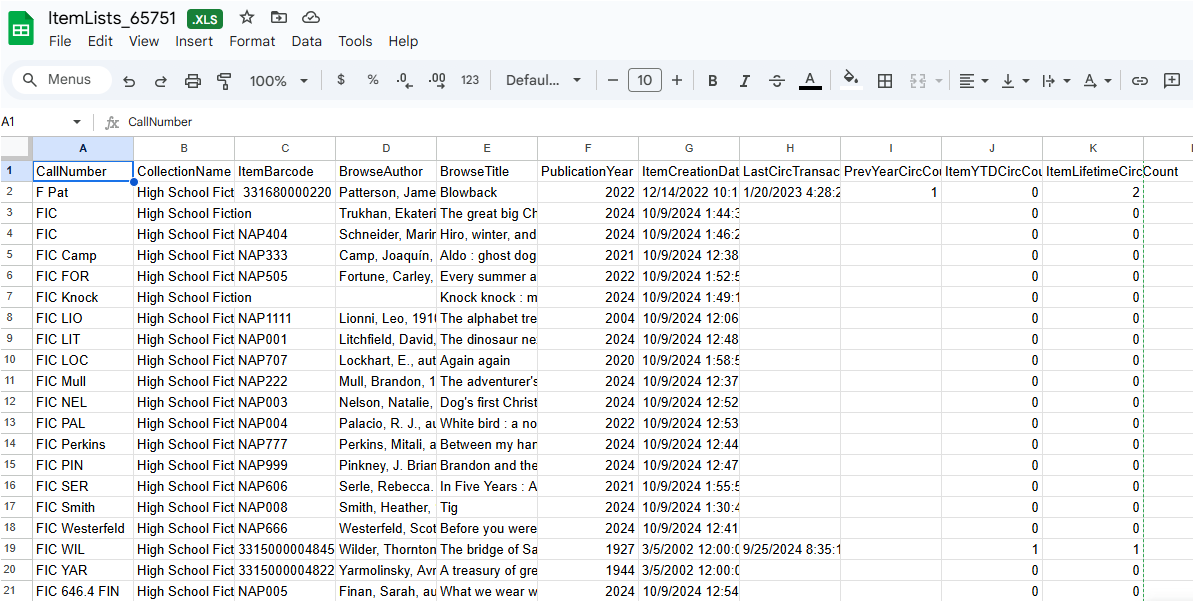
This is what the report appears like in Excel:
Go to the File menu and select “Save As” and save the file as an Excel Workbook.
To make the barcodes column appear as a number, click the column letter (in the example report it is C) use the drop-down menu in the Number section of the Excel ribbon, and select “Number.”

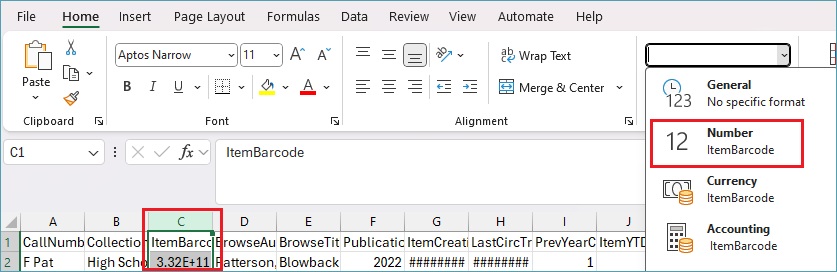
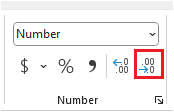
Then click the decimal to the right twice, to get rid of the decimal places.
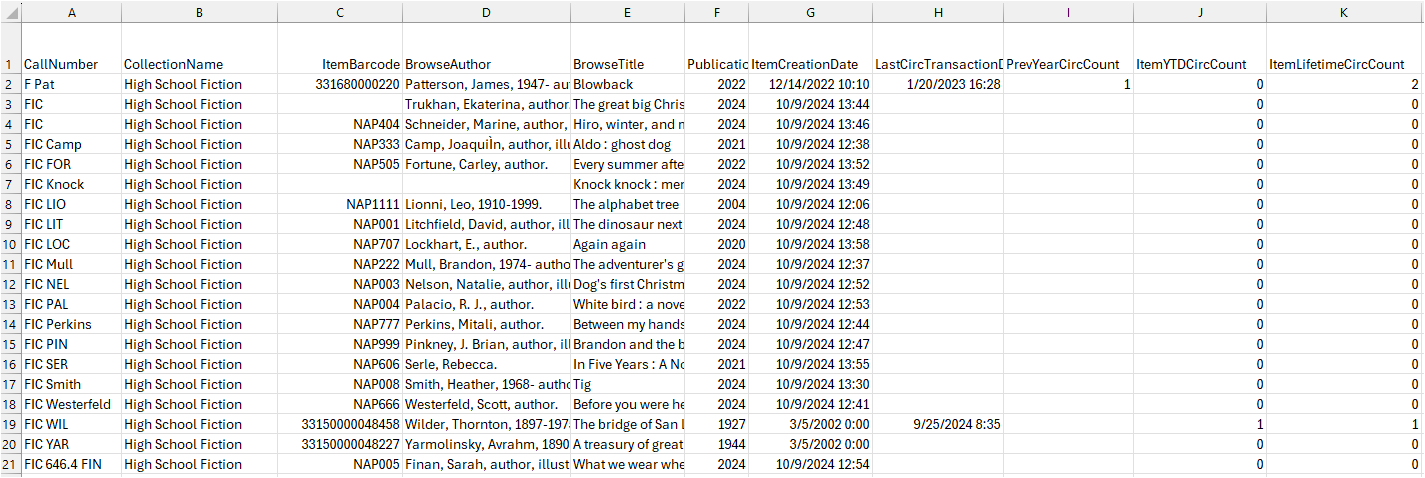
Another tip is to widen the columns for the date columns so the date will display properly. Here is the example report after this formatting has been done:
If you do not have access to Excel, you can also open this report in Google Sheets (you must have a Google account.)
Navigate to https://drive.google.com and log in.
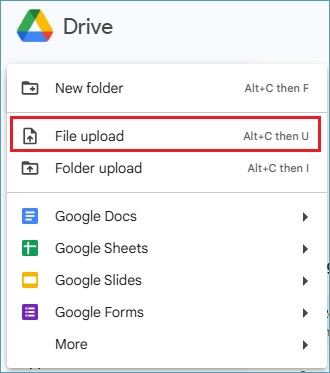
Click on the New button and select File Upload.
Navigate to the downloaded file and select it.
Refresh the webpage and the uploaded file will appear at the top of your list of files. Double-click it to open it. There are no warnings about the file type, and Sheets recognizes the barcodes as numbers, so you do not have to adjust the data type. Here is the example report in Google Sheets:
(2024/12/17)